| Author |
 Topic Topic  |
|
a33272
our battery charger

United Kingdom
3063 Posts |
 Posted - 31/12/2008 : 22:00:17 Posted - 31/12/2008 : 22:00:17


|
| i was thinking of maybe trying to do a yearly one, so chart for 0-12 months 12-24 etc that way could do it as i line graph to show a continual line for indivitual snake, but just wouldnt be possible to do that on one chart for all snakes as would be to many lines i think. but yeah yearly is possible |
    
0.1.0 creamsicle corn-Marmalade
1.0.0 jungle carpet python-Bumble
1.0.0 corn Casper
|
 |
|
|
a33272
our battery charger
United Kingdom
3063 Posts |
Posted - 31/12/2008 : 22:39:58
|
quote:
Originally posted by a33272
mines 8? months an 25g
|
0.1.0 creamsicle corn-Marmalade
1.0.0 jungle carpet python-Bumble
1.0.0 corn Casper
|
|
|
|
a33272
our battery charger
United Kingdom
3063 Posts |
Posted - 31/12/2008 : 23:14:54
|
ok been having a play with what i got so far few probs i can see so few question
what do people want to see just a simple bar graph with name an age at bottom with weight up side which will simpley change in position everytime weight is updated
or a line graph with weight up side, lines for each snake an last month weighed at bottom |
0.1.0 creamsicle corn-Marmalade
1.0.0 jungle carpet python-Bumble
1.0.0 corn Casper
|
Edited by - a33272 on 31/12/2008 23:19:13 |
|
|
|
Blackecho
The Corn Snake Admin

United Kingdom
4379 Posts |
Posted - 31/12/2008 : 23:29:23

|
Why a name? - how about just the average of all snakes at a certain age.
i.e. the average weight at 2 months, 3 months etc etc. |
 
www.theroyalpython.co.uk/forum
Location: Rotherham
 |
|
|
|
a33272
our battery charger
United Kingdom
3063 Posts |
Posted - 31/12/2008 : 23:41:48
|
| looking at the weights so far being so widely spread 23,38,76 for 8 month old average being 45!!!, i think an average would just be to inacurate |
0.1.0 creamsicle corn-Marmalade
1.0.0 jungle carpet python-Bumble
1.0.0 corn Casper
|
|
|
|
gingerpony
Queen Bee
United Kingdom
10455 Posts |
Posted - 02/01/2009 : 19:58:36
|
| could you just discount an 'extreme' weight, like for my 2, them being on a breeder/shop maintenance diet will mean their 1st weights with me are particularly low. |
cornsnakes, ratsnakes, bullsnakes, boas and day geckos
Location:Leeds/York/Selby area |
|
|
|
Blackecho
The Corn Snake Admin
United Kingdom
4379 Posts |
Posted - 02/01/2009 : 20:00:54
|
| I suppose that's the use of an 'average', it will even itself out the more you put into it. |
www.theroyalpython.co.uk/forum
Location: Rotherham
|
|
|
|
a33272
our battery charger
United Kingdom
3063 Posts |
Posted - 02/01/2009 : 20:47:32
|
| IF there is enough intrest in this then yeah an average would proberly be ok |
0.1.0 creamsicle corn-Marmalade
1.0.0 jungle carpet python-Bumble
1.0.0 corn Casper
|
|
|
|
Paulusworm
The Corn Snake Moderator
United Kingdom
686 Posts |
Posted - 02/01/2009 : 21:23:08
|
quote:
Originally posted by matty18714
Put the snake into a pillow case and then onto kitchen scales
or in Matilda-the-Chavcorn's case....
1.Put on wooly gloves
2.Chase around viv for 10 minutes and finally catch, having removed anything that could possibly be used to hide.
3.Get bitten & swear a lot.
4.Wrestle into pillow case.
5.Push back down into pillow case.
6.Wind BIG elastic band around top of pillow case & contemplate throwing said pillow case and contents into nearest large body of water.
7.Weigh, and place cautiously back into viv.
She is getting calmer......honest  . . |

|
|
|
|
a33272
our battery charger
United Kingdom
3063 Posts |
Posted - 02/01/2009 : 21:25:58
|
| hahaha yeah i did notice the wooly gloves in pic earlier |
0.1.0 creamsicle corn-Marmalade
1.0.0 jungle carpet python-Bumble
1.0.0 corn Casper
|
|
|
|
Paulusworm
The Corn Snake Moderator
United Kingdom
686 Posts |
Posted - 02/01/2009 : 22:12:38
|
Couldn't you do a scatter-plot with them and then put a trend-line in? Wouldn't that eliminate the fatties and skinnies and prevent any incorrect averages?
p.s. No I'm not volunteering. I'm quite looking forward to burning my copy of Excel in July when I graduate  . . |
|
|
|
|
a33272
our battery charger
United Kingdom
3063 Posts |
Posted - 02/01/2009 : 22:26:55
|
quote:
Originally posted by Paulusworm
Couldn't you do a scatter-plot with them and then put a trend-line in? Wouldn't that eliminate the fatties and skinnies and prevent any incorrect averages?
im new to this chart stuff haha, but wouldnt a trend line pretty much still follow the average??
|
0.1.0 creamsicle corn-Marmalade
1.0.0 jungle carpet python-Bumble
1.0.0 corn Casper
|
|
|
|
n/a
deleted
25 Posts |
Posted - 02/01/2009 : 22:56:06
|
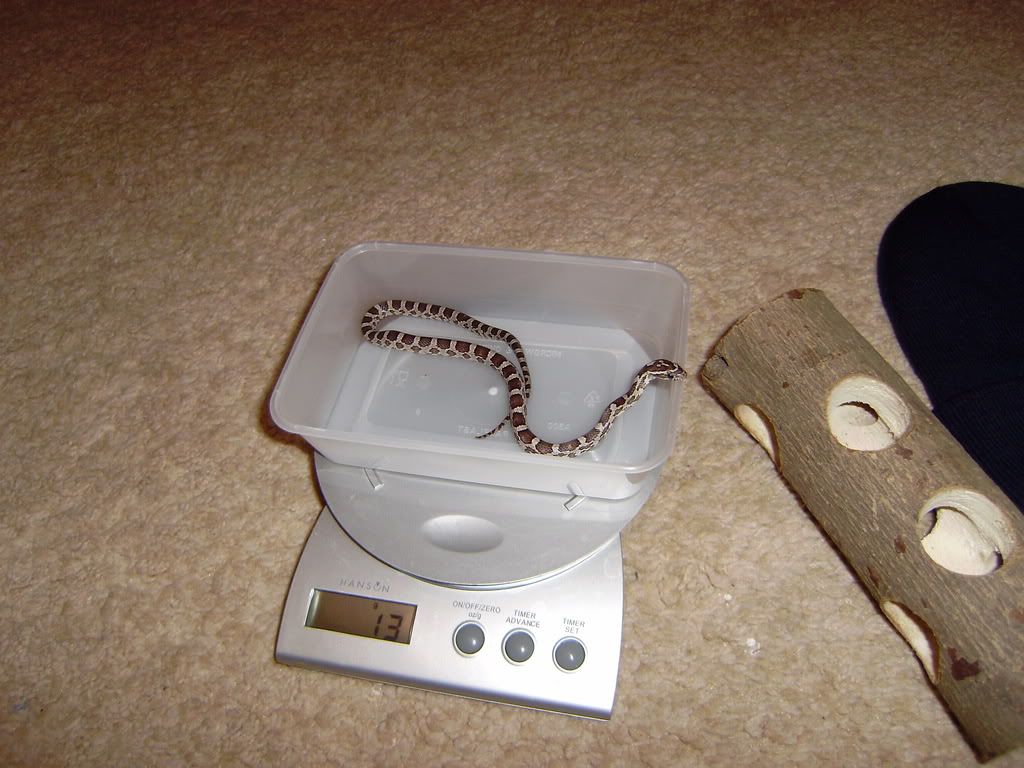
Just weighed stan and hes a huge................
13 grams!
I thought he was about 5 months old but seeing other peoples weights at this age im starting to change my mind.
He must be a couple of months max. He is eating two pinkies very easily though.
Got some great pics from today which i will post 2mo. |
|
|
|
a33272
our battery charger
United Kingdom
3063 Posts |
Posted - 02/01/2009 : 23:20:16
|
| go on the age you think, as ya can see the young ones do seam the have a range of weights |
0.1.0 creamsicle corn-Marmalade
1.0.0 jungle carpet python-Bumble
1.0.0 corn Casper
|
|
|
|
Kehhlyr
ǝʞɐɔ sǝʌoן
United Kingdom
8173 Posts |
Posted - 03/01/2009 : 02:53:20
|
quote:
Originally posted by Kehhlyr
I'll get mine done tomorrow. Although if it makes any odds, i'll be giving my weights just before feeding.
Forgot, then fed them. DOH!
I'll try to get them done in the next few days. |
-=Kehhlyr - The Resident Loon
|
|
|
|
Paulusworm
The Corn Snake Moderator
United Kingdom
686 Posts |
Posted - 03/01/2009 : 08:03:25
|
quote:
Originally posted by a33272
quote:
Originally posted by Paulusworm
Couldn't you do a scatter-plot with them and then put a trend-line in? Wouldn't that eliminate the fatties and skinnies and prevent any incorrect averages?
im new to this chart stuff haha, but wouldnt a trend line pretty much still follow the average??
Initially yes but, you can adjust the x-axis intercept to give a more realistic result  . . |
|
|
|
|
a33272
our battery charger
United Kingdom
3063 Posts |
Posted - 03/01/2009 : 08:06:50
|
[/quote]
Initially yes but, you can adjust the x-axis intercept to give a more realistic result .
[/quote]
ummmmmmmmm what  |
0.1.0 creamsicle corn-Marmalade
1.0.0 jungle carpet python-Bumble
1.0.0 corn Casper
|
|
|
|
Paulusworm
The Corn Snake Moderator
United Kingdom
686 Posts |
Posted - 03/01/2009 : 08:42:54
|
| If you get 1 rogue result you can adjust the point that the trend-line crosses the x-axis so that the rogue data doesn't adversely affect your average. Kinda like a line of best fit on Excel but you can adjust it to make it do what you want it to. |
|
Edited by - Paulusworm on 03/01/2009 08:45:06 |
|
|
|
a33272
our battery charger
United Kingdom
3063 Posts |
Posted - 03/01/2009 : 13:09:02
|
| soooo make up ya own result then haha |
0.1.0 creamsicle corn-Marmalade
1.0.0 jungle carpet python-Bumble
1.0.0 corn Casper
|
|
|
|
n/a
deleted
25 Posts |
Posted - 03/01/2009 : 17:04:25
|
PICY of the weigh in!
 |
|
|
|
Topic |
|